How to Build Net Present Value (NPV) Profile/Graph
NPV graph makes an easy way to visualize whether or not an investment should be undertaken.
Three different points are important to build a NPV graph for a project as follows:
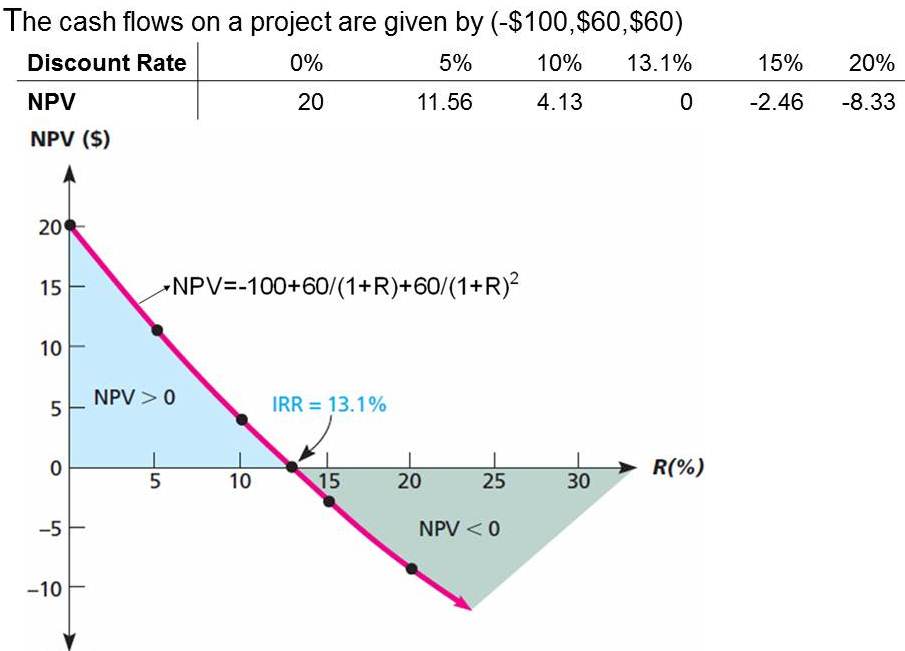
- Determine NPV value at zero discount rate ( r =0)
- Determine NPV value at any discount rate
- Determine discount rate value (IRR= internal rate of return) at zero NPV ( NPV=0)
Note: if we build two or more graphs (e.g. Project A and Project B), we will find cross points via NPV( project A) = NPV ( project B)
Example 1: How to build one Graph/profile
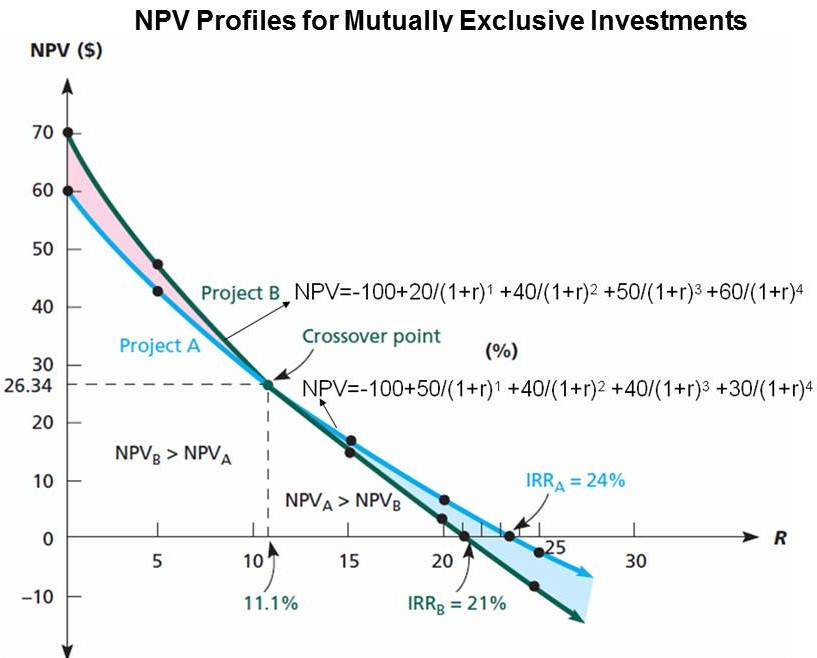
Example 2: How to build more than graphs/Profile for Mutually Exclusive Project
| The cash flows on the two mutually exclusive projects are given as follows: | |||
| Year | Investment A | Investment B | |
| 0 | -$100 | -$100 | |
| 1 | 50 | 20 | |
| 2 | 40 | 40 | |
| 3 | 40 | 50 | |
| 4 | 30 | 60 | |
| Discount Rate | NPV(A) | NPV(B) | |
| 0 | 60 | 70 | |
| 5 | 43.13 | 47.88 | |
| 10 | 29.06 | 29.79 | |
| 11.1 | 26.34 | 26.34 | |
| 15 | 17.18 | 14.82 | |
| 20 | 7.06 | 2.31 | |
| 21 | 5.22 | 0 | |
| 24 | 0 | -6.25 | |
| 25 | -1.63 | -8.22 | |
Mention Mutually Exclusive Investment above:
- The IRR for A (24 percent) is larger than the IRR for B(21 percent)
- The NPV and IRR rankings conflict for some discount rates. If our required return is 10 percent, for instance, then B has the higher NPV and is thus the better of the two even though A has the higher return. If our required return is 15 percent, then there is no ranking conflict: A is better.
- The NPV profiles cross at about 11 percent. Notice also that at any discount rate less than 11 percent, the NPV for B is higher. In this range, taking B benefits us more than taking A, even though A’s IRR is higher. At any rate greater than 11 percent, Project A has the greater NPV.
- In mutually exclusive investment, looking at IRRs can be misleading, but the option with the higher NPV is preferred, regardless of the relative returns.
Note: we can find crossover point by:
- NPVA =-100+50/(1+r)^1 +40/(1+r)^2 +40/(1+r)^3 +30/(1+r)^4
- NPVB =-100+20/(1+r)^1 +40/(1+r)^2 +50/(1+r)^3 +60/(1+r)^4
Crossover point when NPVA= NPVB
-100+50/(1+r)^1 +40/(1+r)^2 +40/(1+r)^3 +30/(1+r)^4 =-100+20/(1+r)^1 +40/(1+r)^2 +50/(1+r)^3 +60/(1+r)^4
30/(1+r)^1 – 10/(1+r)^3 – 30/(1+r)^4=0
r (Crossover rate)=11.1% => NPVA (r=11.1%) = NPVB (r=11.1%) =26.34
So Crossover point(11.1% ; 26.34)
Source:
- Phnom Penh HR
- Mcgraw-Hill – Fundamentals Of Corporate Finance